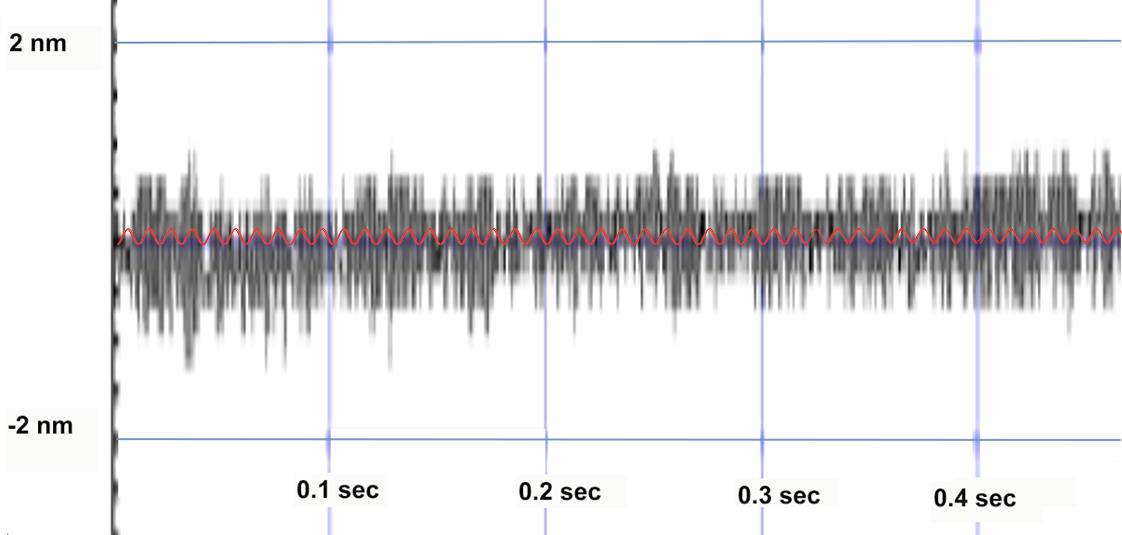
The trace above, measured by a laser interferometer, shows peak-to peak noise (black) of a linear motor positioning system on the order of 1.8 nm (controller is actively holding a position, no position change commanded).
The noise measured by the external metrology (laser) contains the sum of all mechanical and electrical sources – the amplifier noise, the servo noise, the sensor noise, the vibrational noise from ground and, accoustic disturbances etc. Can the data be used to predict the smalllest step size this linear positioning system can perform?Yes and no. An experienced test enineer can tell a lot from this data but it has to be interpreted using additional knowledge about the system. The results could be very different based on the type of mecahnical and electrical components such as frictionless vs. traditional bearings and drives (air bearings, magnetic bearings, flexure guides, ball bearings, cross-roller bearings; linear motors vs motor/screwdrives), driver design (linear vs PWM, voltage vs current control, etc), servo and position sensor type (analog vs digital), motor type (electromagnetic vs piezo, linear vs. stepper).
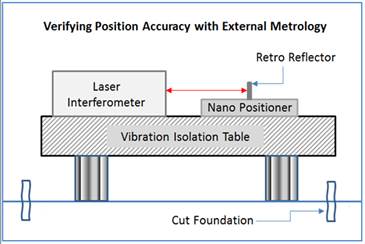
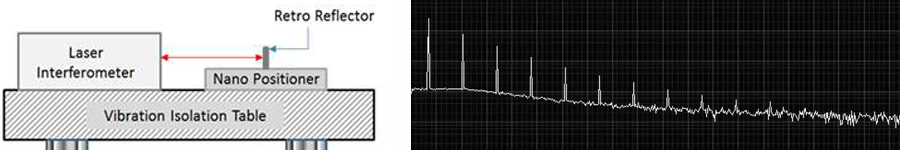
A better way is to actuallymeasure commanded vs. actual steps, with traceable, non-contacting external metrology, such as laser interferometers. Sometimes it is suggested to skip this somewhat elaborate process and just excite a frequency in the positioning stage using the positioning systems’s internal sensor and frequency domain measurements to determine resolution and stability. Let’s think about what it means for the above example.
What if a very weak A/C voltage, a continous sinewave, equivalent to 0.1 nm peak-peak motion (red trace in the graph above) was fed into the motor input, and the resulting stage vibration were analyzed using FFT (Fast Fourier Transform) techniques. Would the specific excitation frequency stand out in the random noise spectrum? Very likely.
Would the result indicate the positioning stage be able to execute individual, repeatable steps of 0.1nm magnitude? Unlikely. Here is another example to put this method in perspective.
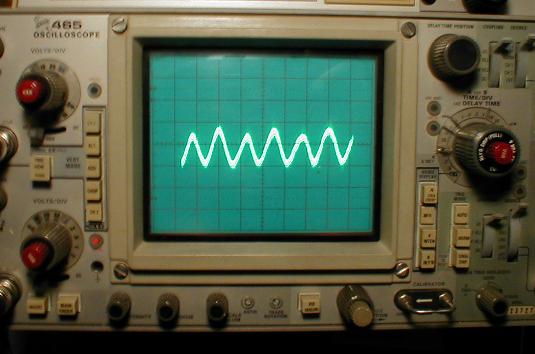
If a sinewave is played on a smart phone speaker at very low volume, it will cause nanometric vibration on the phone’s screen. The motion can be detected by a laser or even by the phone’s internal accelerometers. When FFT-analyzed, the frequency of the specific sinewave will show up in the spectrum.
So, if the FFT analysis indicates the phone is vibrating at a certain frequency with an amplitude in the micrometer or nanometer range, does that turn the phone into a micropositioning or nanopositioning device? Not really. When choosing a metrology tool or method to verify the performance of a precision positioning device, it is important to understand the way the device works and how the data needs to be interpreted to get useful information for its specific application. Frequency domain measurements via FFT are state-of-the-art and extremely valuable for analyzing mechanical systems when it comes to finding resonances, structural issues, unwanted local vibrations, etc. However, its value for measuring position resolution and long term stability is very limited.
If interpreted out of context frequency domain measurements can lead to fantastic resolution or noise floor results that on second thought do not make too much sense. Single digit picometer noise floor–that is equivalent to less than 1/10th of the diameter of a hydrogen atom. Very unlikely, unless the experiment is taking place in an out-of-this-world lab.
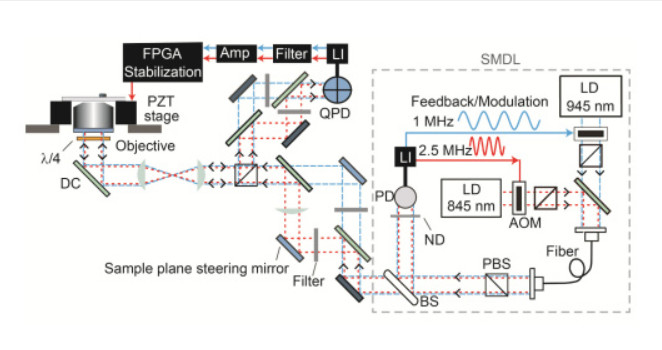
The National Institute of Standards recently published an article on a new stability record where a complex dual laser beam-based measurement system was used to achieve sub-nm drift. The experiment setup uses a multi-axis piezo stage with capacitive feedback, model P561.3DD from PI.
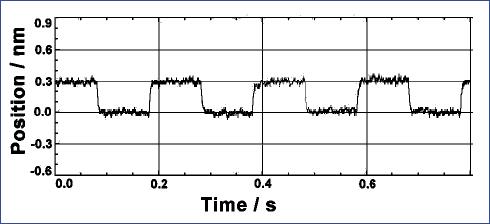
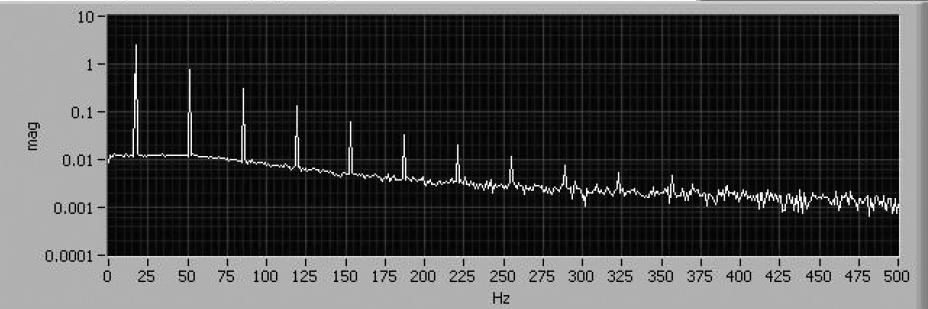
Point-to-point positioning, measured in the time domain at the motion platform using traceable instrumentation (top figure), duplicates actual usage. Qualities such as rise time, overshoot, ringing, stability and noise are evident. Motion of a positioning system (bottom figure) viewed in the frequency domain, none of the above qualities are evident.


Blog Categories
- Aero-Space
- Air Bearing Stages, Components, Systems
- Astronomy
- Automation, Nano-Automation
- Beamline Instrumentation
- Bio-Medical
- Hexapods
- Imaging & Microscopy
- Laser Machining, Processing
- Linear Actuators
- Linear Motor, Positioning System
- Metrology
- Microscopy
- Motorized Precision Positioners
- Multi-Axis Motion
- Nanopositioning
- Photonics
- Piezo Actuators, Motors
- Piezo Mechanics
- Piezo Transducers / Sensors
- Precision Machining
- Semicon
- Software Tools
- UHV Positioning Stage
- Voice Coil Linear Actuator
- X-Ray Spectroscopy